Contents
Score=α(H(xiU))−α1(MI(xiU,T))
- H(xiU)
H(xiU)=−q=0∑Qc=0∑cp(yi=c∣xiU)log(p(yi=c∣xiU))
- MI(xiU,T)
MI=xiT∑P(xiU,xiT)log(P(xiT)P(xjU)P(xiT,xjU))
Old
Score1=H(xiU)+λ(xiU)
Score2=MI(xiU,T)
Score3=MI(xiU,U)
Score1=H(xiU)+λ(xiU)
Score2=α⋅MI(xiU,U)−α1⋅MI(xiU,T)
α=1
Dataset
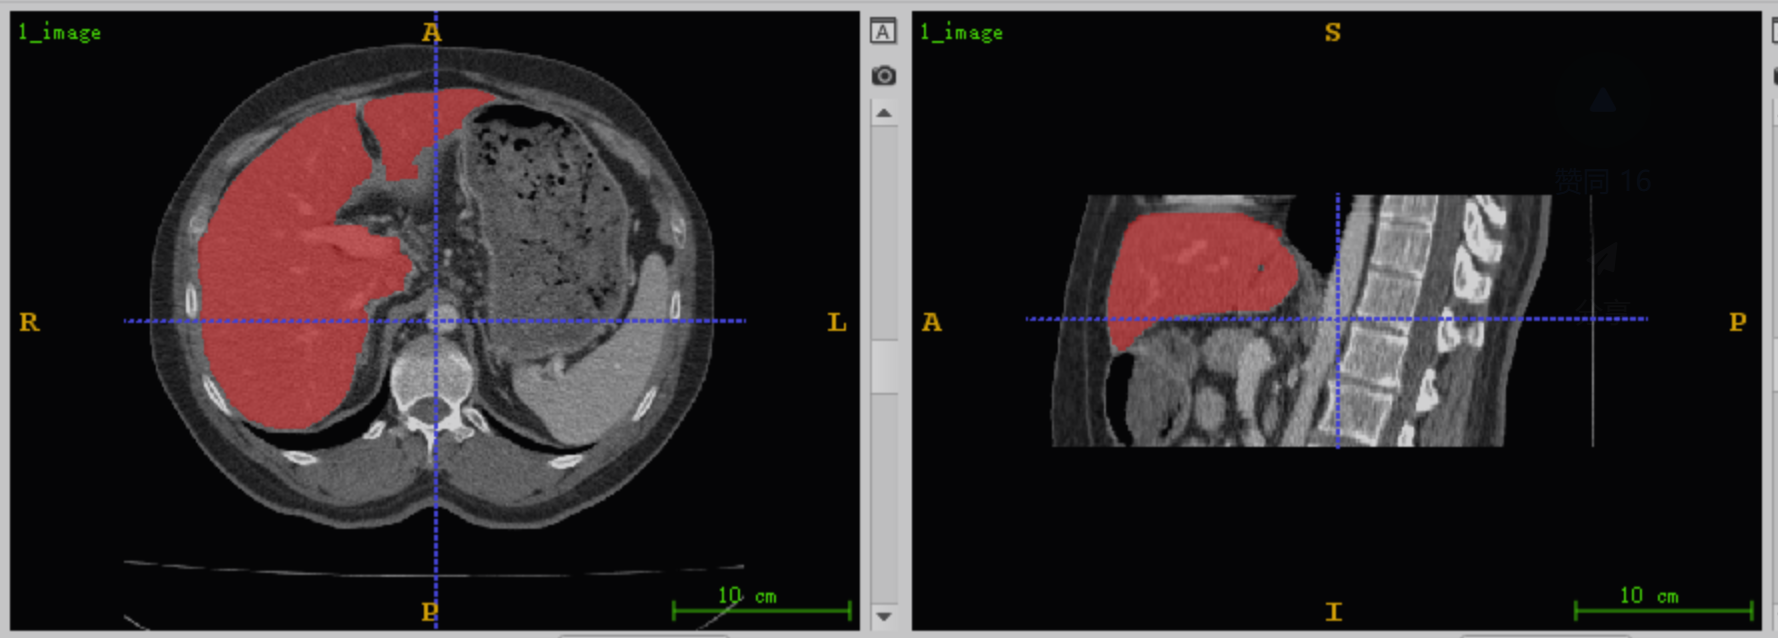
CHAOS - Combined (CT-MR) Healthy Abdominal Organ Segmentation
Homepage

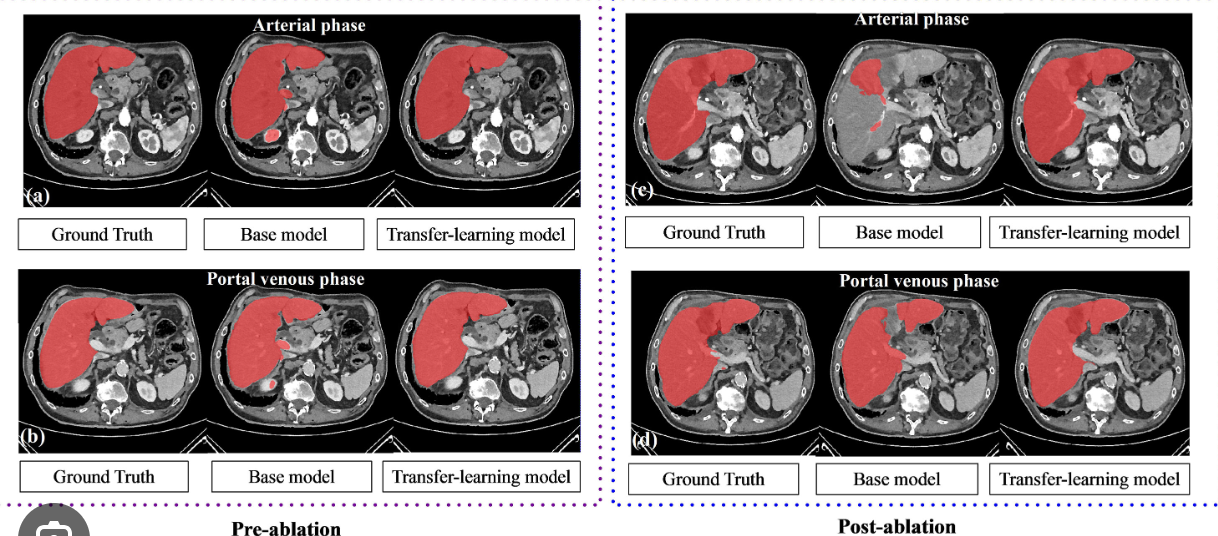
Liver and Liver Tumor Segmentation
Kaggle homepage | Homepage
The liver is a common site of primary (i.e. originating in the liver like hepatocellular carcinoma, HCC) or secondary (i.e. spreading to the liver like colorectal cancer) tumor development. Due to their heterogeneous and diffusive shape, automatic segmentation of tumor lesions is very challenging. Until now, only interactive methods achieved acceptable results segmenting liver lesions.
130 CT scans, resized to 256x256 and converted to PNG for segmentation of the liver as well as tumor lesions.

BKAI-IGH NeoPolyp-Small
Kaggle homepage
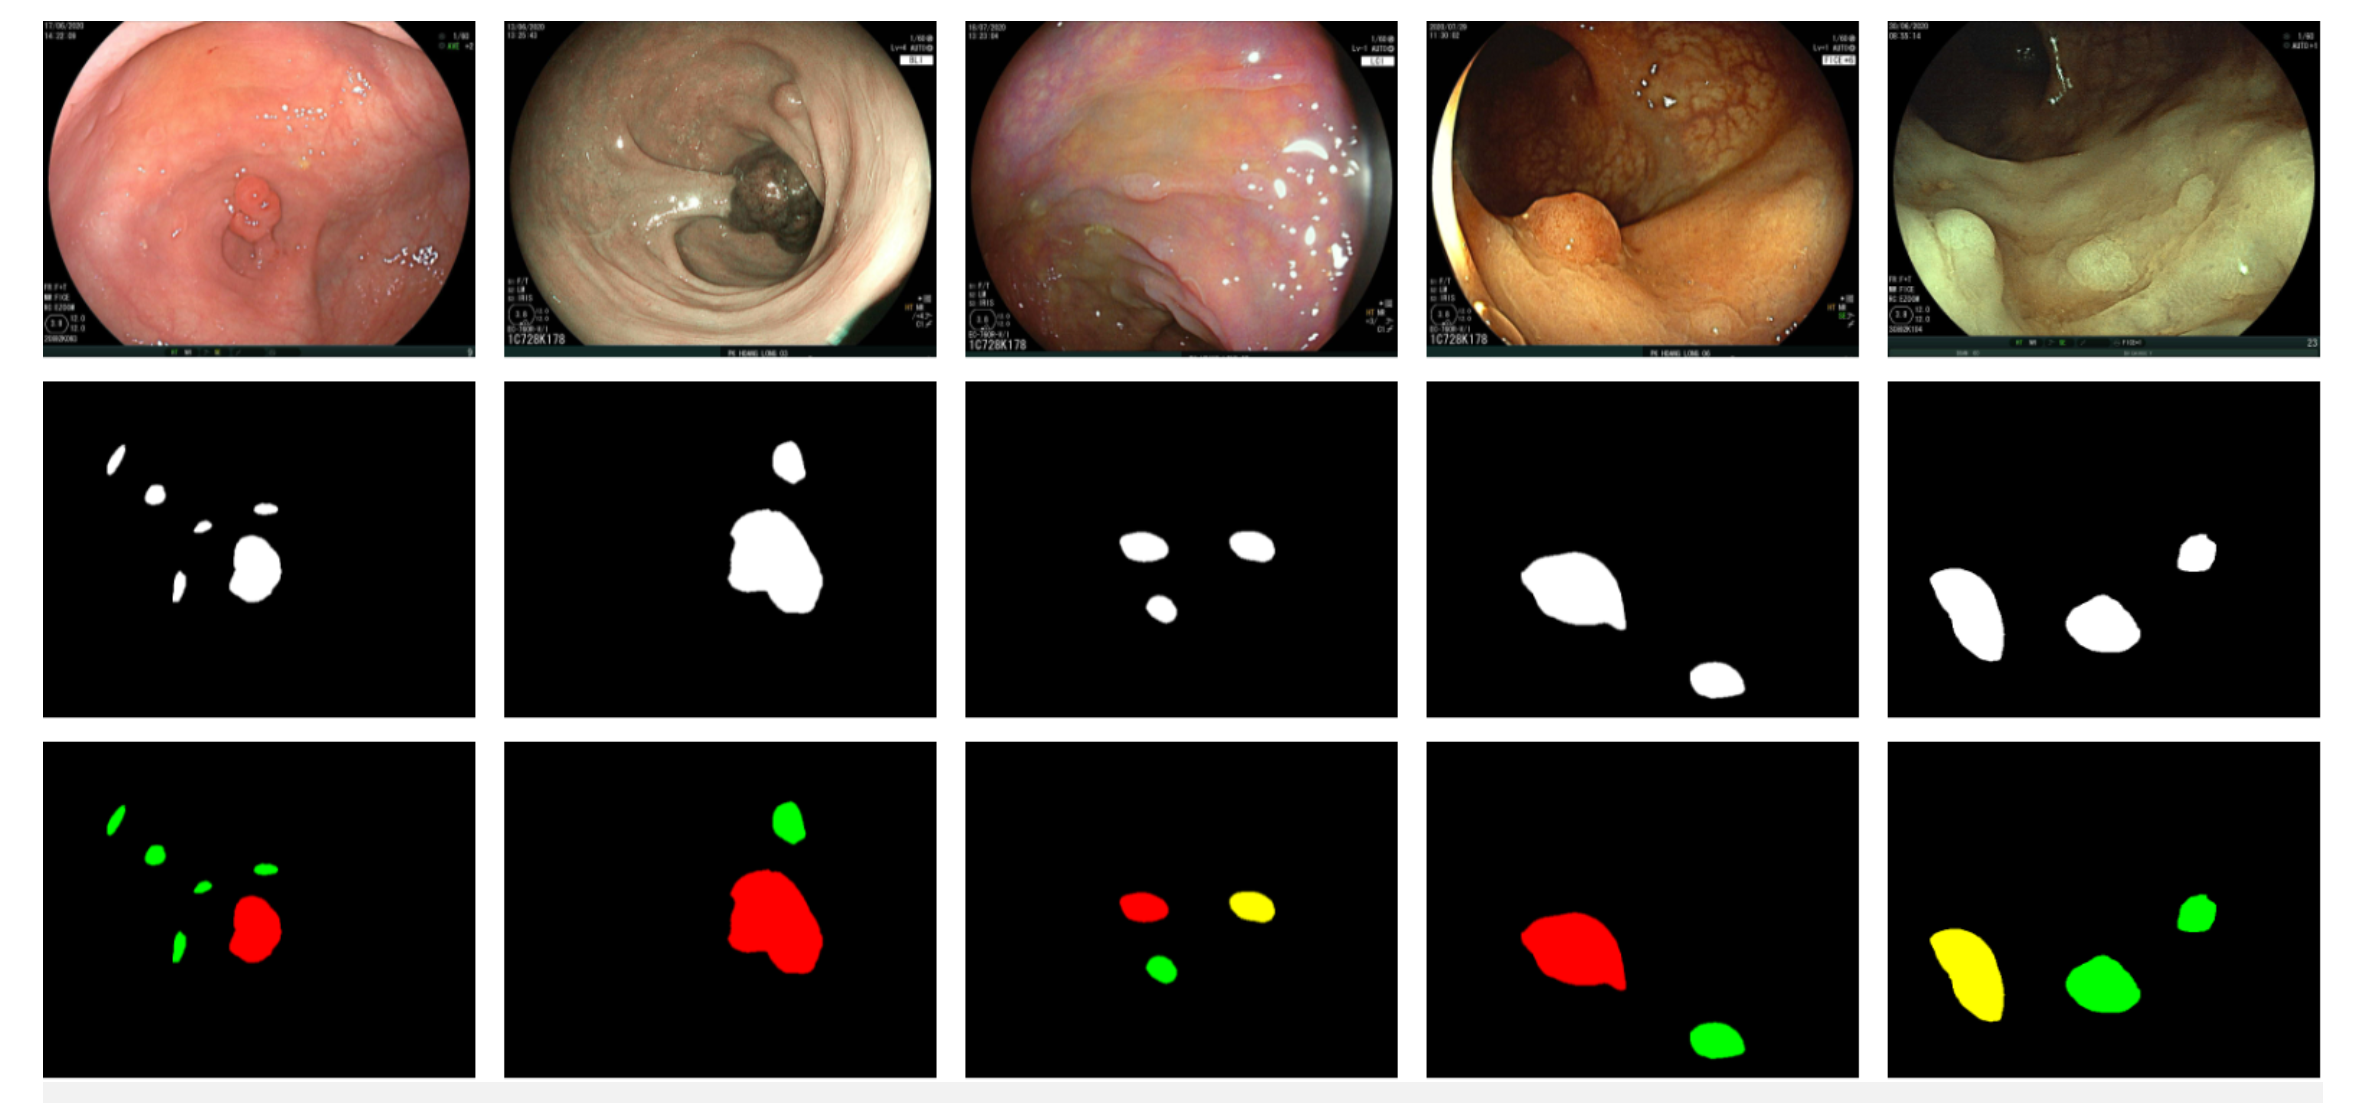
This dataset contains 1200 images (1000 WLI images and 200 FICE images) with fine-grained segmentation annotations. The training set consists of 1000 images, and the test set consists of 200 images. All polyps are classified into neoplastic or non-neoplastic classes denoted by red and green colors, respectively.


